Memory Consuming Issue of Logging Lib
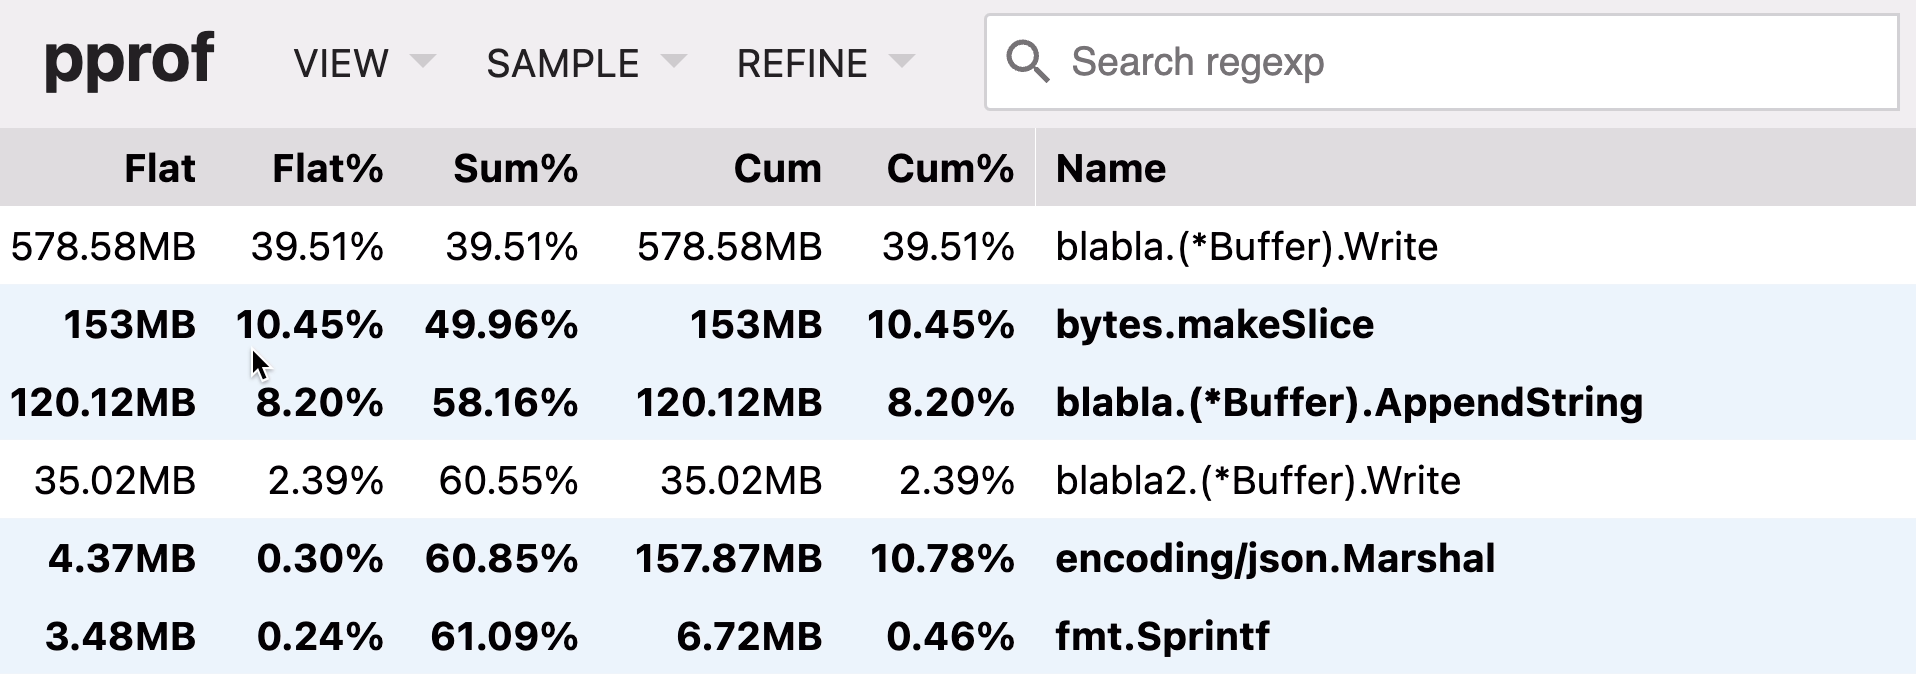
One of users reported he found the RPC logging interceptor consumes a lot of memory, so we checked the profiler first and then found the image below and the blabla is the underlying log library.
This blog records how to do troubleshooting this issue. However, as lacking more details, I handed over the issue to the log team for further checking.
Here is an answer about flat and cum of profiling.
Appending
In short, append utilizes the old slice storage and allocates new slots to store the copied new slice, as the growslice reads. Hence, given a slice with size \(x\) and another slice with size \(y\), the append operation will consume additional \(y\) bytes due to the copy. The memory usage grows from \(x+y\) into \(x+2y\). The old slice might be cleared by GC but it's not sure yet when appending.
Moreover, the growth strategy means the slice might have unused bytes, which consumes some memories as well. From Go@1.20, it applies a smoother growth formula:
before go1.20:
-- growing 2x for < 1024 elements and 1.25x for >= 1024 elements

after go1.20
++ starting cap    growth factor
++ 256             2.0
++ 512             1.63
++ 1024            1.44
++ 2048            1.35
++ 4096            1.30
Diagnosing
With the knowledge above, we could realize the log message might be huge. Otherwise, the makeSlice won't take so many memories. What's more, the Write simply wraps a append function call. Hence, the total memory consuming is caused by the appending. As a result, we soon realize it might be an issue that users pass huge size messages for logging. For example, the payload of request/response is quite huge.
After checking with users, their response payload is around 60Kb and QPS is 40. Based on the newest strategy, additional \(4096*1.3^11-60*1024=12006B=12KB\) size of memory is used per log. Within these data, we can know that the logs require around 5MB memory per seconds.
However, why the log library consumes more than 500MB memory? That's the issue here. If the fields are serialized fast and write into file on time, the objects won't consume a lot of memory as soon they will be released.
Conclusion
I prefer it's a problem from the log lib, so I handed over the issue to them.