Tracing System Keynotes
This is a keynote blog about the tracing system, including the tracing platform, sdk, the whole work flow, and the problem it wants to solve. It's not a manual or a very detail page to introduce how tracing works.
Trace, Span and SpanContext
Tracing tries to better understand the behaviors across multiple processes communicating by RPC. Observing the call stack is not the scope of tracing.
The primary unit of a distributed trace is Span, it holds some three important IDs(TraceID, SpanID and Parent SpanID), with more tags additionally. Usually, we will see the combination of them at a span level where appending IDs together with colon separator:
c2b4aae411f2a8bab4349a9ba1a71c00:000000a2d7b8af21:0000000000000000
<------------------------------> <--------------> <-------------->
        trace ID                    Span ID        Parent Span ID

c2b4aae411f2a8bab4349a9ba1a71c00:0100005c9249a589:000000a2d7b8af21
Multiple spans could be chained together as a graph to represent the whole work flow for a distributed system.
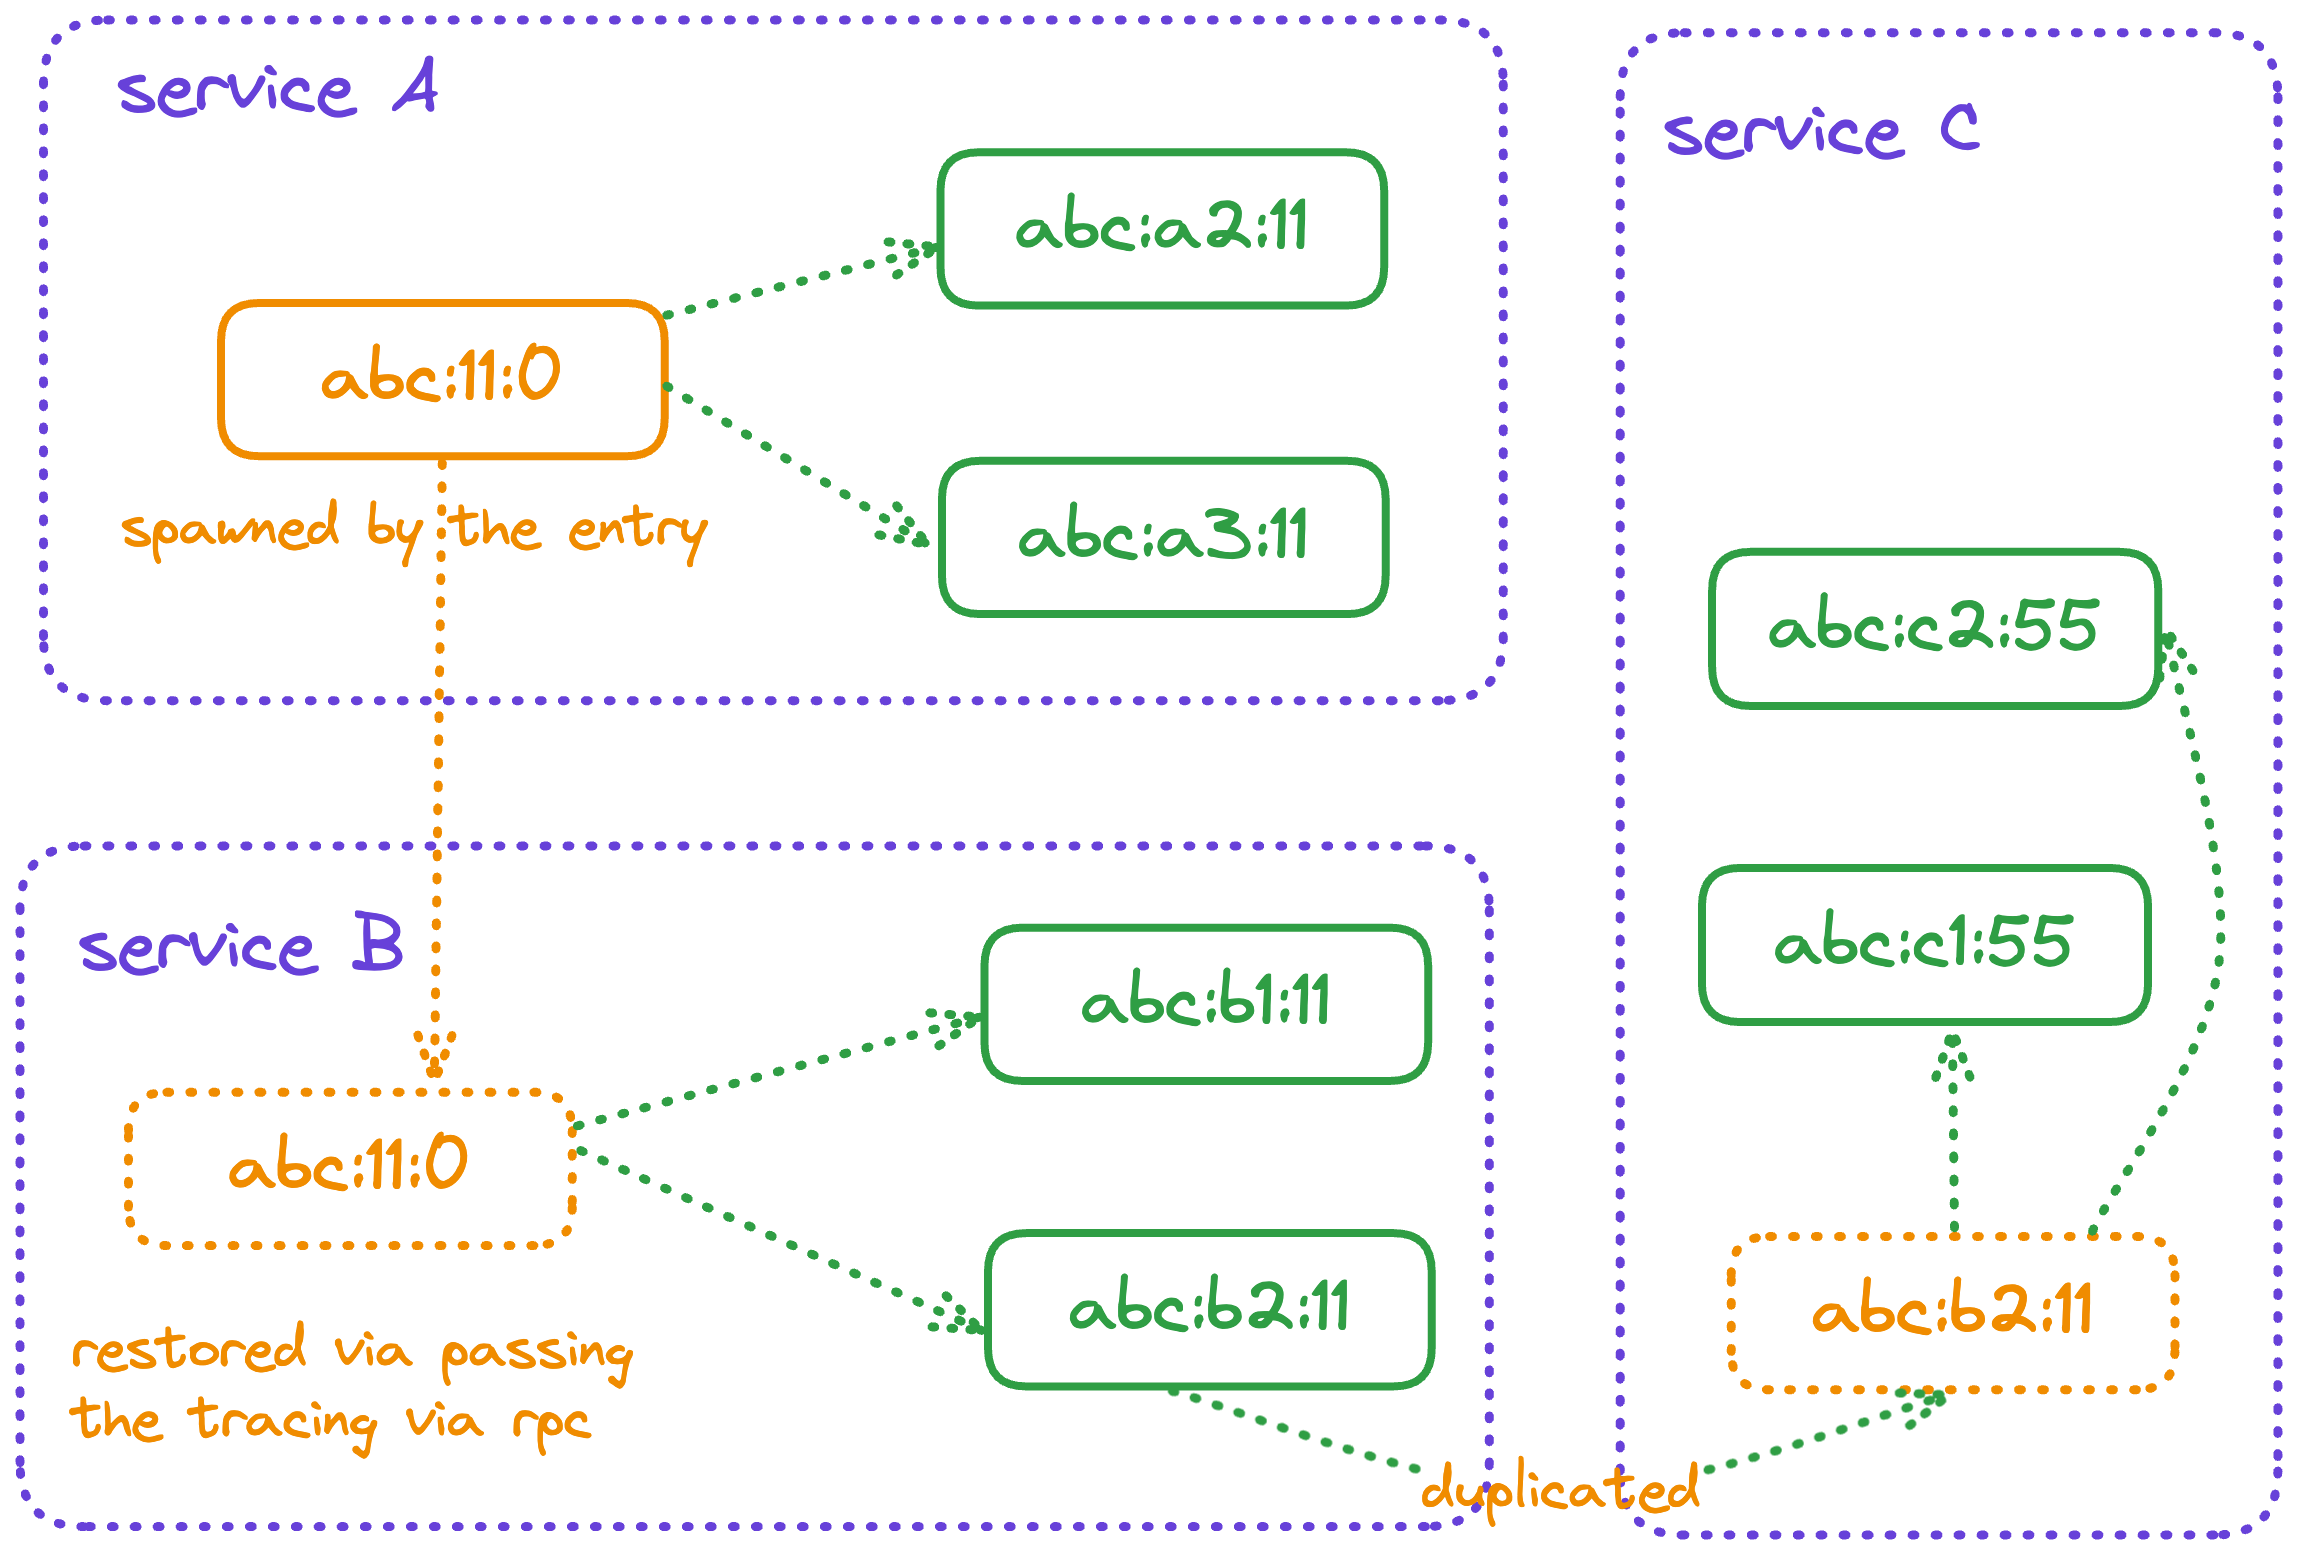
Given a traceID(abc in the diagram above), all spans relate to a trace could be found as a un-ordered set, and span IDs chain each other to emit the call graph. The SpanID doesn't contain concrete timestamp but some bits for a time serial to decide the chronicle of several spans.
Spans are attached to the same trace by generating spans with SpanContext. However, during RPC the span context isn't propagated, instead the trace string(such as c2b4aae411f2a8bab4349a9ba1a71c00:000000a2d7b8af21:0000000000000000) is propagated and restored in the upstream service.
Timestamps are stored in Span, Not SpanID
In practice, the (start/end) timestamp is stored not in SpanID but the span which will be reported by Finish function call.
- spanID is static, so it forbids to override the start time.
- better to store the end time and start time in the same place, but the end time is not sure yet when creating a span.
- capacity limitation from the spanID, to represent a timestamp, it requires at least
32-bitsfor one timestamp(2038 problem), even though we can shift the time to store it with less bits while losing some information, we still hard to say the timestamp is stored inside spanID.
Conclusion
- trace: a whole flow among multiple services in a distributed system.
- span context: Holds the trace information, including the relationship with the parent span, and is used to create new spans. It typically includes trace ID, span ID, and other metadata.
- span: Contains all the data about a specific operation within a trace, such as start and end times, attributes, and events. It is used to report this information to a tracing platform
Per Server Level SpanContext Generator
SpanContext is a request-level context shared across the request processing and it's hold inside a span. However, it is usually carried by context to pass through the callstack.
The SpanContext is generated by a process level(global singleton) generator.
Process Level or Server Level?
One process might have multiple servers such as one http server and one gRPC server, and which scope should the generator belong to, process or server?
Remembering tracing focuses on tracking flow among RPC services, so usually it has a grain at service level. As a result, the generator should be the process(RPC service) level.
Hence, the options for generator to creat new span context is per server level because different server might have different strategies for SpanContext.
Sample Rate and Tail Based Sampling
The sampling rate is specified when creating a generator instead of the Jaeger Tracer, and it's fair to determine whether to report a piece of trace when creating it. The trouble of attaching with Jaeger tracer is the synchronization across the RPC call-chain services.
As the trace information is passed to the upstream in requests, it's neutral to bind the sampling rate to a generator.
However, as the sampling decision made when the initial client doesn't know what will happen in downstream, the traces of abnormal requests are not reported and useful diagnosing records are missed.
To solve this, Tail Based Sampling feature allows a middle server to report the whole trace which is not sampled in client side. This method requires the communication between the jaeger tracers among the whole call-chain.
How JaegerTracer Reports Spans
Jaeger tracer takes charge of reporting spans to remote platform. As a result, it's usually a global singleton. Each RPC service owns its own global JaegerTracer.
Span Finish Interface
In opentracing, "reporting a span" is done by Finish a span and the name "Finish" is derived from the opentracing-go interface method FinishWithOptions. The generator will generate spans by choosing one implementation of Span based on its strategies.
// Span represents an active, un-finished span in the OpenTracing system.
//
// Spans are created by the Tracer interface.
type Span interface {
    // Sets the end timestamp and finalizes Span state.
    //
    // With the exception of calls to Context() (which are always allowed),
    // Finish() must be the last call made to any span instance, and to do
    // otherwise leads to undefined behavior.
    Finish()
    // FinishWithOptions is like Finish() but with explicit control over
    // timestamps and log data.
    FinishWithOptions(opts FinishOptions)

    // ignore lines...
}
Tracer Finishes Spans Implementation
Uber Tracer is a popular implementation of jaeger tracer to report spans, while it provides an implementation of Span as well.
The RPC to submit spans to platform is worthy mentioning. Usually, it's used thrift protocol to submit spans via reporter component, either UDP or HTTP and tracing platform is compatible with both of them.
- Jaeger Thrift over UDP or HTTP
- Zipkin Thrift over HTTP
In this blog, I won't introduce the implementation about the reporting details because it's out of the scope of current blog.
Best Practices
Integration
Propagating the trace through the whole RPC callchain is significant, otherwise the traces are cut and incomplete. In real practice, propagating trace context should be done mostly by common libraries and infrastures of a company.
Special Requirements for Tracing
Normal tracing with a sampling rate looks good, until it gets trouble for some special requirements. For example:
- debug: get tracing for this request when diagnosing without sampling
- stress test: some requests are sent for stress testing, we don't want the tracing data
- sampling: how to open and close the sampling for a trace
- priority: whether one trace should have a higher precedence for sampling
For these requirements, jaeger tracing doesn't have a solution for them. As a result, we need to find a place to store them.
These requirements require a feature on the trace level, hence generally the bits with special meaning are stored inside TraceID.
Collect
Reporting could be done in push/pull way and each of them has their own pros and cons.
- push: per span level, take efforts on server side once the span is pushed(no latency)
- pull: a batch of spans level, periodically controlled by server interval setting up(has a certain interval of latency)
Push model will produce high QPS to tracing platform. For example, one API has 100QPS and create 5 child spans, the sampling rate is 2%, the reporting QPS will be 10QPS per service. It will be numerous if we multiply the API and service numbers. To avoid the overload of platform, push model is used when certain flag is set up.
Reversely, the pull model doesn't produce much workload for platfrom, while having the latency until the next collection turn.
In the real practice, proxies are deployed at the host machine of k8s cluster to aggregate the pushed spans from services. Depending on the flags, the proxy decides to push the spans to platform or waiting the platform to collect it periodically.
Cooperate with Log Middleware
For many components, the log interceptor/hooks are widely used in the components to record the request/response details, so it's possible for them to integrate tracing to attach the logs with a certain trace. This requires the log and tracing system cooperates to collect the information, aggregate and arrange them properly.